What is the difference between Data Analytics, Data Analysis, Data Mining, Data Science, Machine Learning, and Big Data?
by Pratik
Posted on August 24, 2015 at 9:00 PM
First things first, doing stuff with data, whatever you want to call it is going to require some investment - fortunately the entry price has come right down and you can do pretty much all of this at home with a reasonably priced machine and online access to a host of free or purchased resources. Commercial organizations have realized that there is huge value hiding in the data and are employing the techniques you ask about to realize that value. Ultimately what all of this work produces is insights, things that you may not have known otherwise. Insights are the items of information that cause a change in behavior.
Let's begin with a real world example, looking at a farm that is growing strawberries (here's a simple backgrounder The Secret Life Of California's World-Class Strawberries, this High-Tech Greenhouse Yields Winter Strawberries , and this Growing Strawberry Plants Commercially)
What would a farmer need to consider if they are growing strawberries? The farmer will be selecting the types of plants, fertilizers, pesticides. Also looking at machinery, transportation, storage and labor. Weather, water supply and pestlience are also likely concerns. Ultimately the farmer is also investigating the market price so supply and demand and timing of the harvest (which will determine the dates to prepare the soil, to plant, to thin out the crop, to nurture and to harvest) are also concerns.
So the objective of all the data work is to create insights that will help the farmer make a set of decisions that will optimize their commercial growing operation.
Let's think about the data available to the farmer, here's a simplified breakdown:
1. Historic weather patterns
2. Plant breeding data and productivity for each strain
3. Fertilizer specifications
4. Pesticide specifications
5. Soil productivity data
6. Pest cycle data
7. Machinery cost, reliability, fault and cost data
8. Water supply data
9. Historic supply and demand data
10. Market spot price and futures data
Now to explain the definitions in context (with some made-up insights, so if you're a strawberry farmer, this might not be the best set of examples):
Big Data: Using all of the data available to provide new insights to a problem. Traditionally the farmer may have made their decisions based on only a few of the available data points, for example selecting the breeds of strawberries that had the highest yield for their soil and water table. The Big Data approach may show that the market price slightly earlier in the season is a lot higher and local weather patterns are such that a new breed variation of strawberry would do well. So the insight would be switching to a new breed would allow the farmer to take advantage of a higher prices earlier in the season, and the cost of labor, storage and transportation at that time would be slightly lower. There's another thing you might hear in the Big Data marketing hype: Volume, Velocity, Variety, Veracity - so there is a huge amount of data here, a lot of data is being generated each minute (so weather patterns, stock prices and machine sensors), and the data is liable to change at any time (e.g. a new source of social media data that is a great predictor for consumer demand),
Data Analysis: Analysis is really a heuristic activity, where scanning through all the data the analyst gains some insight. Looking at a single data set - say the one on machine reliability, I might be able to say that certain machines are expensive to purchase but have fewer general operational faults leading to less downtime and lower maintenance costs. There are other cheaper machines that are more costly in the long run. The farmer might not have enough working capital to afford the expensive machine and they would have to decide whether to purchase the cheaper machine and incur the additional maintenance costs and risk the downtime or to borrow money with the interest payment, to afford the expensive machine.
Data Analytics: Analytics is about applying a mechanical or algorithmic process to derive the insights for example running through various data sets looking for meaningful correlations between them. Looking at the weather data and pest data we see that there is a high correlation of a certain type of fungus when the humidity level reaches a certain point. The future weather projections for the next few months (during planting season) predict a low humidity level and therefore lowered risk of that fungus. For the farmer this might mean being able to plant a certain type of strawberry, higher yield, higher market price and not needing to purchase a certain fungicide.
Data Mining: this term was most widely used in the late 90's and early 00's when a business consolidated all of its data into an Enterprise Data Warehouse. All of that data was brought together to discover previously unknown trends, anomalies and correlations such as the famed 'beer and diapers' correlation (Diapers, Beer, and data science in retail). Going back to the strawberries, assuming that our farmer was a large conglomerate like Cargill, then all of the data above would be sitting ready for analysis in the warehouse so questions such as this could be answered with relative ease: What is the best time to harvest strawberries to get the highest market price? Given certain soil conditions and rainfall patterns at a location, what are the highest yielding strawberry breeds that we should grow?
Data Science: a combination of mathematics, statistics, programming, the context of the problem being solved, ingenious ways of capturing data that may not be being captured right now plus the ability to look at things 'differently' (like this Why UPS Trucks Don't Turn Left ) and of course the significant and necessary activity of cleansing, preparing and aligning the data. So in the strawberry industry we're going to be building some models that tell us when the optimal time is to sell, which gives us the time to harvest which gives us a combination of breeds to plant at various times to maximize overall yield. We might be short of consumer demand data - so maybe we figure out that when strawberry recipes are published online or on television, then demand goes up - and Tweets and Instagram or Facebook likes provide an indicator of demand. Then we need to align demand data up with market price to give us the final insights and maybe to create a way to drive up demand by promoting certain social media activity.
Machine Learning: this is one of the tools used by data scientist, where a model is created that mathematically describes a certain process and its outcomes, then the model provides recommendations and monitors the results once those recommendations are implemented and uses the results to improve the model. When Google provides a set of results for the search term "strawberry" people might click on the first 3 entries and ignore the 4th one - over time, that 4th entry will not appear as high in the results because the machine is learning what users are responding to. Applied to the farm, when the system creates recommendations for which breeds of strawberry to plant, and collects the results on the yeilds for each berry under various soil and weather conditions, machine learning will allow it to build a model that can make a better set of recommendations for the next growing season.
I am adding this next one because there seems to be some popular misconceptions as to what this means. My belief is that 'predictive' is much overused and hyped.
Predictive Analytics: Creating a quantitative model that allows an outcome to be predicted based on as much historical information as can be gathered. In this input data, there will be multiple variables to consider, some of which may be significant and others less significant in determining the outcome. The predictive model determines what signals in the data can be used to make an accurate prediction. The models become useful if there are certain variables than can be changed that will increase chances of a desired outcome. So what might be useful for our strawberry farmer to want to predict? Let's go back to the commercial strawberry grower who is selling product to grocery retailers and food manufacturers - the supply deals are in tens and hundreds of thousands of dollars and there is a large salesforce. How can they predict whether a deal is likely to close or not? To begin with, they could look at the history of that company and the quantities and frequencies of produce purchased over time, the most recent purchases being stronger indicators. They could then look at the salesperson's history of selling that product to those types of companies. Those are the obvious indicators. Less obvious ones would be the what competing growers are also bidding for the contract, perhaps certain competitors always win because they always undercut. How many visits the rep has paid to the prospective client over the year, how many emails and phone calls. How many product complaints has the prospective client made regarding product quality? Have all our deliveries been the correct quantity, delivered on time? All of these variables may contribute to the next deal being closed. If there is enough historical data, we can build a model that will predict that a deal will close or not. We can use a sample of the historic data set aside to test if the model works. If we are confident, then we can use it to predict the next deal
7 Ways to Use Google Trends You’ve Never Thought of Before
by Kanu
Posted on August 25, 2015 at 9:00 PM

Google Trends now boasts a “story-centric” homepage, where it aggregates data from Google Search, YouTube and Google News and ranks the most searched for stories. This is by far the most comprehensive trends aggregate you’ll find on the web.
So if I click on iOS Apple Inc., which is number 3 on the trending list above, I’m taken to a dashboard about the story everyone’s talking about: a security flaw in iOS 9 & iOS 9.0.1.
The dashboard shows me the relevant articles on the topic, a trending video, as well as changes in interest in the topic over the past few days.
If your business is in the tech niche, then this would be a great opportunity for content creation – posting a piece on a widely trending topic will help draw traffic to your site. You can even make sure that you capitalize on the topic when you see evidence that interest is growing.
Find real-time marketing opportunities
Google Trends is now offering minute-by-minute, real-time data from more than 100-billion searches through the engine monthly, which allows you to evaluate search trends during different times, or even at major events, such as the Oscars or the World Cup. You can choose any time period from the past week to see the minute-by-minute data.
So how can you use this data for real-time marketing? By watching spikes in search terms during major events, you can quickly determine what topics are grabbing people’s interest.
A classic example of real-time marketing using Google Trends information comes from Oreo’s timely tweet during Super Bowl in 2013, when the lights went out in the New Orleans Superdome for 34 minutes.
Oreo’s marketing team threw this ad together on the fly. Twitter users loved it and shared it — the single tweet has had more than 15,000 retweets up to today. Think about events that would be a good marketing venue for your brand and look for fast opportunities to employ real-time marketing to increase your brand’s reach on social media.
Research niche topics by geography
Now, you can search for just about any topic in Google Trends and see the popularity of the topic in searches by geography. If you haven’t started a local marketing campaign yet, this is a great place to begin. If you’re hoping to expand or improve it, this is also a great resource. Let’s say I’m an organic chicken distributor looking to expand my business. Where should I set up shop? Just type “organic chicken” into Google Trends and it comes up with helpful data about regional interest in the search term, including a ranking of search by city.
I am adding this next one because there seems to be some popular misconceptions as to what this means. My belief is that 'predictive' is much overused and hyped.
Research brand health
Google Trends is a great way for larger brands to understand their brand health compared to their competitors. This kind of information can help inform where companies need to work harder to increase their influence.
Let’s say I work with Nissan, and I want to see how our brand measures up to other auto companies in the state of Florida. I just set the following terms on my Google Trends search:

And instantly, I can see the top auto/vehicle queries for Florida in the last 30 days.
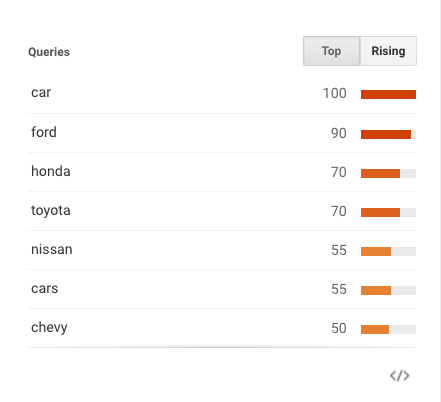
Looks like Ford, Honda and Toyota are doing better in this state, so I know I’ve got some work ahead of me. Depending on the goals you have for your brand, you can also search by certain city in Florida, by the entire US, by a different country, or worldwide.
Research local shopping trends
Another great (and underused) feature of Google Trends is the ability to search for shopping trends in isolation. This data will show you consumers’ purchasing intent for different searches. If you’re a realtor, or looking to be one, this kind of information can be very valuable.
Check out this map put together by Benjamin Spiegel from Marketing Land:
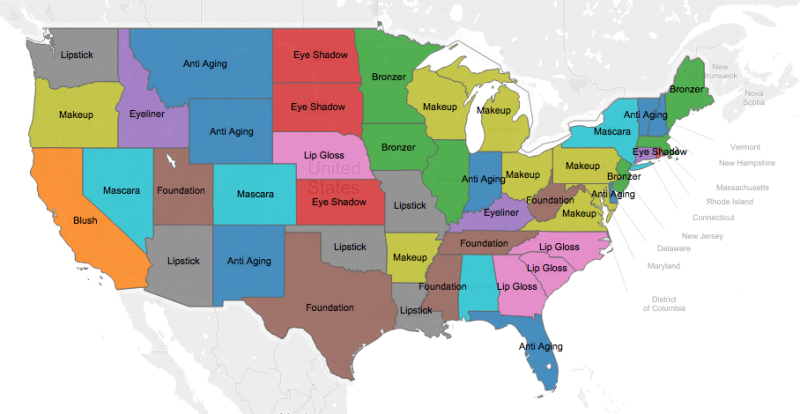
To create this compelling graphic, he searched Google Shopping for the highest purchase intent for beauty products for each state last February. The resulting map shows us the products people most want to buy in these states.
If you sell beauty products, this data could show you where you’ll get the most value for your advertising spend. Adjust your marketing and content campaigns to match the demand in each market.
Brainstorm content with Google Correlate
Google Correlate can help you figure out what topics people want to read about, which can ultimately help you figure out what topics you should be writing about, or how to relate a topic to others that people are interested in.
Using Google Correlate, you can find associations between search trends and any other data point that you want to write about. It’s the only tool on the internet that can do this with search data, yet it goes largely unused.
The Google tutorial explains that Correlate is like the opposite of Trends:
Google Correlate is like Google Trends in reverse. With Google Trends, you type in a query and get back a data series of activity (over time or in each US state). With Google Correlate, you enter a data series (the target) and get back a list of queries whose data series follows a similar pattern.
Let’s say I run a niche blog for baking recipes, and I want to draw more traffic to my site. I can type “baking” into Google Correlate:
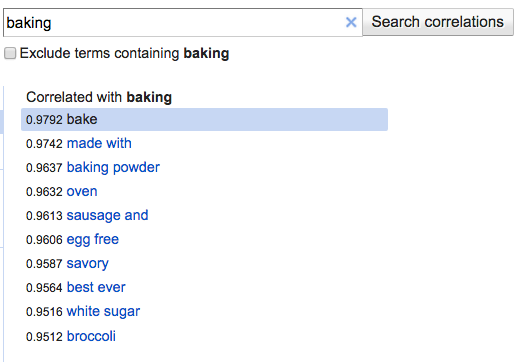
And I see instantly that baking has a pretty high correlation with the search terms “egg free,” “sausage,” and “broccoli.” Knowing this, I might decide to write up some new recipes with these ingredients in mind, since that’s where search interest lies.
If you’re statistically inclined, Google Correlate even allows you to upload your own dataset to see what search terms correlate with it. Just click the “Enter your own data” link next to the search bar and upload your Excel file.
Let Google do the analysis for you
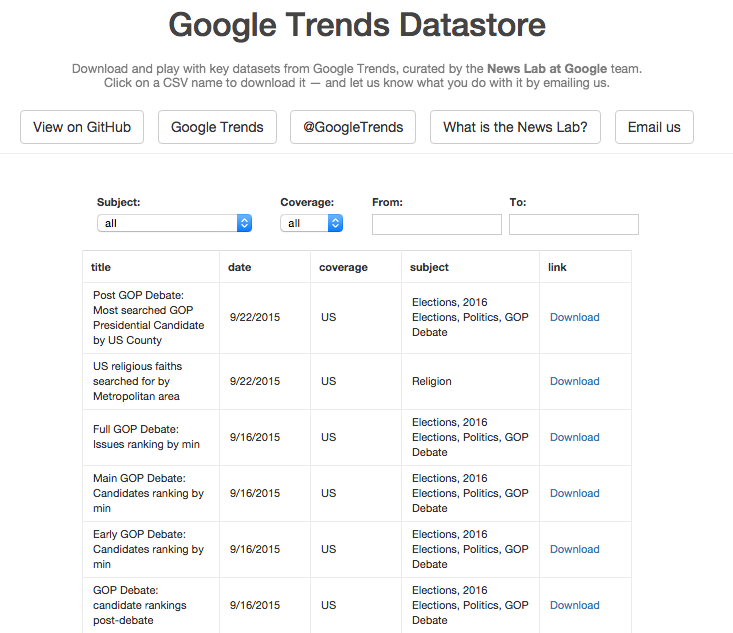
In a recent change to Google Trends, the Google News Lab has begun doing their own analyses of trending stories every day and offering useful information about the topics, which you can download from the Google Trends Datastore. If you’re a journalist or content creator, or if you have one on your team, this can be an invaluable tool.
What if I’m writing a story about the latest GOP debate? I can use this tool to find data about the most searched for GOP candidate by county, the debate issues ranking by minute, and the candidates’ rankings post-debate, among many other relevant topics that can serve as useful statistics to add meat to the story.
This is a great way to add credibility to what I’m going to say in a written piece about public interest, without waiting for the next Gallop Poll.
So those are my favorite seven new or underused features of Google Trends that you can use to develop a marketing strategy, improve your SEO, or brainstorm content.
It might be difficult to visualize how exactly you can apply these tools to your own business goals, which is why I recommend trying them out and checking back often – opportunities will arise and the ways to stay on top of the game are endless.
Have you ever experimented with these Google Trends features? Have another great tool to share? Leave me a note in the comments section below:
Note: The opinions expressed in this article are the views of the author, and not necessarily the views of Caphyon, its staff, or its partners.
What are the top 10 mobile (iPhone, Android) app development companies? Should i outsource mobile app development, software developemt or analytics?
by Anupam
Posted on August 2, 2016 at 5:00 PM
While i was working as a developer, one of the biggest problems which clients faced while having a call with me during the development phase was that they were not sure about the exact structure and design evolution of the app, which wasted a lot of time recoding the whole thing, after finding a design flaw. To overcome this , i started getting the screens designed from the client first, that didnt completely help with the backend though. One day i suggested my client to get a SRS prepared , it wont take much effort or money but will save a lot of rework i said. I was amazed when he had our company prepare a 60 page document with every screen. After getting the complete specification , the development didnt take more than 2 months and it was rather smooth with less amount of time wasted on calls.
If you are looking to outsource mobile or any software development, first get a structure and SRS prepared either from the same company or either yourself. Ask for suggestions from the developer , they know what works best , they have worked on it. Managers can just handle the business case , not the actual experience of the app. Make sure you consistently monitor the quality of server side programming and deployment, remember its not just the UI or UX , a big chunk of user experience comes from the quickness of fetching the data.
As far as choosing a company goes , if you wont be available to monitor the coding yourself make sure to hire a company who always have a senior guy to monitor the technical aspects of your software or application. Remember the CEO’s of the company doesnt do that, if you have to pay extra , do that , but always try to hire a quality architect from the company your outsource. Try not to cut costs on quality of developers but negotiate on manager costs , ask for a technical lead instead, because he will be the one to monitor the code quality and initial architecture of the backend and frontend services.
Lastly it would be an added advantage if the company believes in your idea or problem you are trying to solve. Company top management matters a lot, try to read them and see if they are really into technology problem solving or they are just another business men. Brainstorm with the top management and have a meeting atleast twice a week.
Happy Solving :)
drafteq.com